Breadcrumbs

MnLineChart

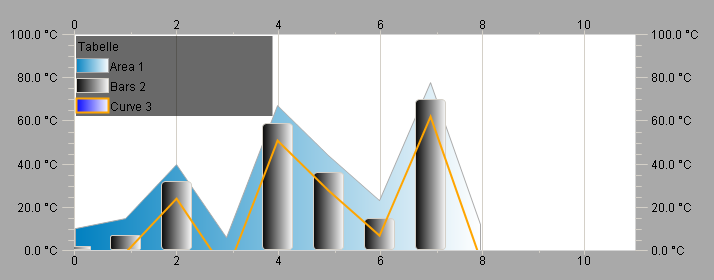
The Line Diagram element can be used to display one or more diagrams.  

  MnLineChart01.bmp


Parameters

Property

Description 

Hintergrund 

Wallpaper

Linien über Diagramme 

X und Y Gitter werden über den Diagrammen dargestellt. 

X-Achse 

Settings and variables for the X axis

  • Start and End Index of the displayed values.

  • ScalingAbsolute: Main scaling are indexes with fixed offset, which are displayed.Divider: Number of lines to be displayed from start to end index.

  • Label position, line color, line style, font, text rotation, font color.

Y-Achse 

Settings and variables for the Y axis

  • Start and end scaling, the range of the displayed values

  • scalingAbsolute: Main scaling is the range with fixed offset which is displayed.Divider: Number of lines to be displayed from start to end range.

  • Label Position, line color, line style, font, text rotation, font color, format.

Beschriftung 

Setting for all labels of the diagram points. 

UseStructArray 

Flag whether a StructArray or single arrays should be used for the data. 

Daten 

StructArray = TRUE

  • Common variable for all X and Y axes, where the first STRUCT variable applies to the X axis).

StructArray = FALSE

  • Variables for single X and Y axes.

Diagramme 

Diagram settings.

  • Title: Name of the diagram

  • Type: diagram typebarsRounded barslinesConnected linescurvesurfacecircles

  • Show Markers: Displays markers and text values in the graph.

  • State variable: Dynamic show/hide of the graph.

  • Relative width for the graphs, bars and lines.

  • Line in foreground: The frame is also drawn in the foreground.

  • Lines Width, Lines Style, Lines Color

  • Content Colour


Remarks

  • Arrays must always start with index 0.